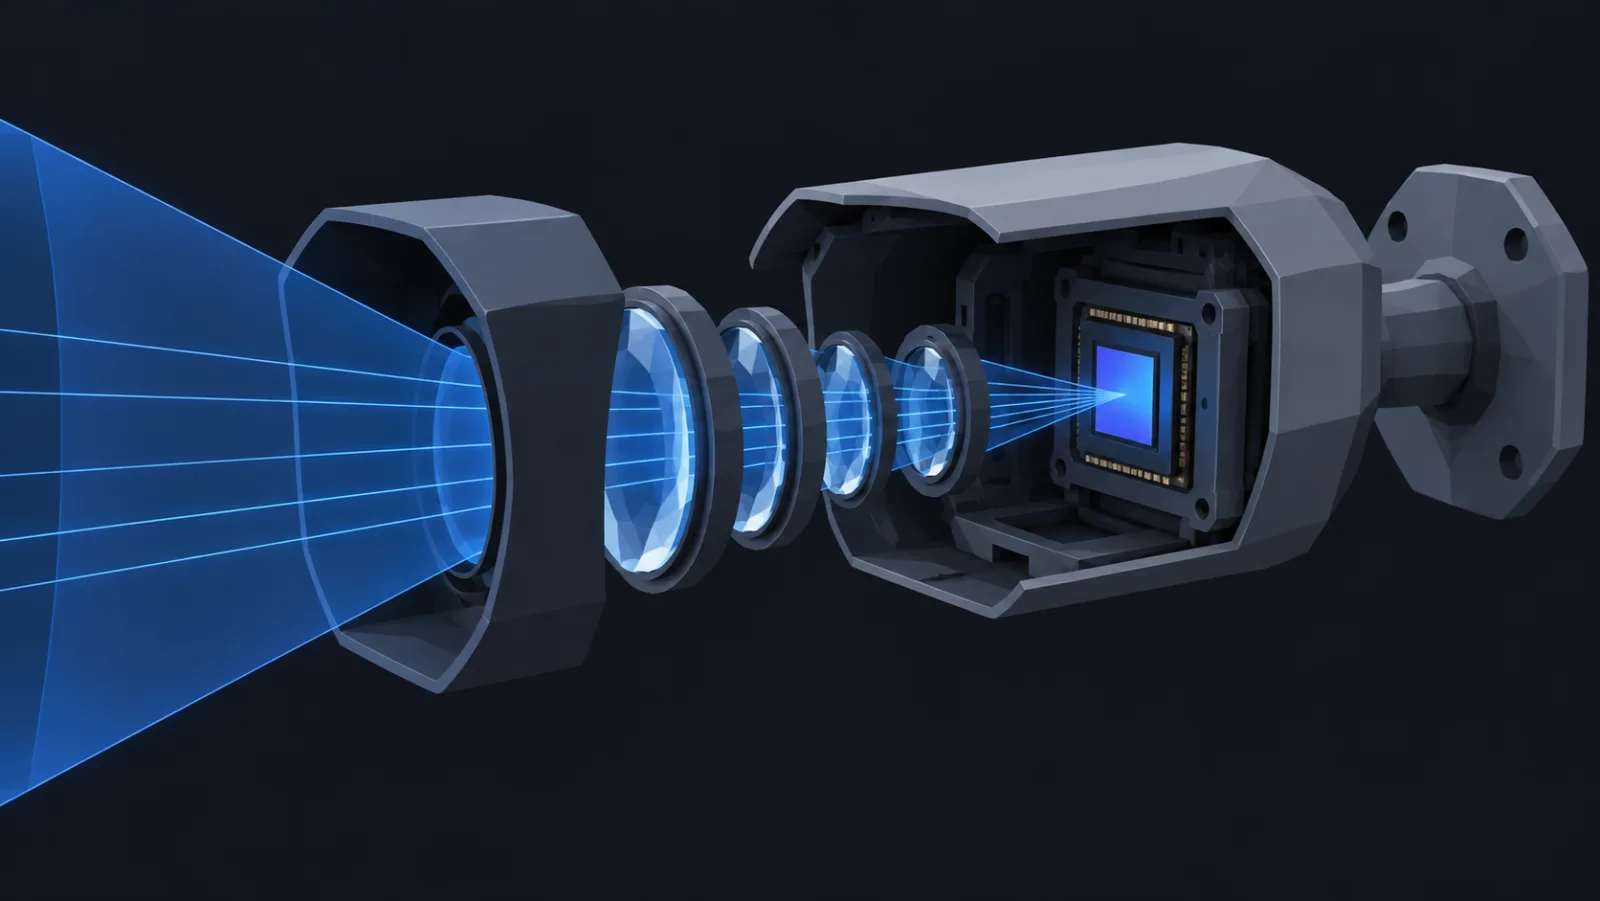
About the figures. Every figure and table below is drawn in your browser by the optics code behind the camera database, which is a copy of the model the editor uses to draw cones and DORI rings. None of them is hand-plotted; when the model changes, the paper changes with it.
1. From a sensor and a lens to an angle
A camera is a pinhole with a sensor behind it. For an ordinary (rectilinear) lens, the horizontal field of view follows from the sensor's width w and the focal length f:
hfov = 2 · atan(w / (2 · f))Sensor sizes are named in an old tube-camera convention — "1/2.8 inch" is not 1/2.8 of an inch across — so the model keeps a table of real widths: a 1/2.8″ sensor is about 5.4 mm wide, a 1/1.8″ one about 7.2 mm. That is why "2.8 mm" alone says little about the view: the same lens is far wider on the bigger sensor.
Datasheets usually publish the angle, and a published angle always wins over this formula: real wide-angle lenses carry distortion and the camera may crop the sensor, so a "2.8 mm" camera that measures 100° or more is common. Where a varifocal lens publishes its angles at a few focal lengths, the model interpolates between them in 1/f, which is the curve the formula follows, rather than in f, which would bow the wrong way.
2. Pixel density falls with distance
At distance d the camera's view is 2 · d · tan(hfov / 2) metres wide, and its horizontal pixel count is spread across that width. Pixel density on a target is the one number that decides what an operator can do with the image:
px/m(d) = W / (2 · d · tan(hfov / 2))Take the camera the rest of this paper follows: 4 MP, 2560 pixels wide, on a 1/2.8″ sensor. With a 2.8 mm lens it sees 88° and delivers about 133 px/m at 10 m. With an 8 mm lens it sees 37°, and the same pixels go nearly three times further.
3. DORI: the thresholds as distances
EN 62676-4 ties four operator tasks to four densities: detect at 25 px/m, observe at 62.5, recognise at 125, identify at 250 (see DORI, explained). Invert the density formula and each threshold becomes a distance. For the 2.8 mm lens the identify range is 5.3 m; for the 8 mm lens it is 15.3 m. The wide lens buys coverage and pays for it in reach.
Fisheye and panoramic lenses do not follow the rectilinear formula: their image height grows in step with the angle, not its tangent. The model switches to that equidistant projection for lenses that say they use it, and for anything wider than 120° that does not say, so a 180° fisheye gets a finite and honest density at the edge instead of the zero the tangent would give.
4. Height, tilt and the blind spot
A camera on a wall looks down. Its vertical field of view, from the horizontal one and the sensor's aspect, sets two lines on the floor: where the image starts and where it ends. Everything between the wall and the first line is out of view.
With a vertical field of view of 57°, the floor is in view from 1.5 m out to 25.7 m. Tilt further down and the blind strip shrinks while the far edge comes in; tilt up and the reverse. The practical consequence, worked through in the mounting-height article, is that cameras should watch each other's walls: the blind strip under one sits inside the cone of the next.
5. The ladder, for common cameras
The same functions, run across a grid of common resolutions and lenses on a 1/2.8″ sensor. Use it as a first pick; the catalog record of the actual model, with its published angle, is what goes on the drawing.
| Resolution | Lens | Angle | Identify | Recognise | Observe | Detect |
|---|
6. What the model leaves out
- Light. Density is a ceiling. At night the image is limited by noise, infrared range and motion blur long before pixels run out; see low light.
- Compression. A heavily compressed stream loses fine detail first, which is the detail identify depends on.
- Angle to the target. The formulas measure density across the image. A face seen from steeply above occupies fewer useful pixels than one seen head-on at the same distance.
- Lens quality. A cheap lens may not resolve what the sensor can record, especially at the edges of the frame.
Those are the reasons a plan should aim inside the identify ring, not at its edge. The geometry is exact; the conditions around it are not.